 Beequation

Learn › Maths topics for Classes 1 to 5 › Data handling
Maths topics · Classes 1 to 5
Data handling
How many children chose each fruit? Which shape appears most often in a box of blocks? Collecting and organising information helps children answer questions using evidence rather than a guess.
Primary data work begins with sorting real objects and keeping careful counts. Tables, pictographs and bar graphs then give different ways to display the same information. A child should be able to explain what a display represents, not only name the tallest bar.
All the fruit counts on this page are invented teaching examples, not results from a survey or claims about children's preferences.
How data work develops
- Class 1: sort objects and record counts with marks or pictures.
- Class 2: tally marks and simple pictographs.
- Class 3: pictographs with a key (“one picture = 5 children”); simple bar graphs in some books.
- Class 4: pictographs in the NCERT book; bar graphs in many books.
- Class 5: bar graphs (in the NCERT book), reading scales and comparing data.
Follow your child's textbook for the order. Line graphs and averages appear in some private books in Class 5, but not in the NCERT books for Classes 1 to 5.
Begin with a question that can be counted
“Which of these three fruits would you choose?” is clearer than “What is your favourite food?” when the plan is to compare three fruit categories. Tell each participant to choose one option if the total is meant to represent people.
Keep categories separate. If the choices are banana, mango and guava, record a mango choice under mango, not under a second category such as “sweet fruit”. Overlapping categories can count the same response twice.
For practice at school or home, use anonymous choices and small, non-sensitive questions. There is no need to collect names, marks, family income or other personal details to learn graph skills.
Agree the categories before counting. Afterwards, add the category totals and compare them with the number of responses. If the totals differ, investigate the counting rather than altering the graph to hide the difference.
Tally marks help keep track
A tally mark records one mark for each item or response. After four upright marks, the fifth crosses the group. Grouping in fives makes larger counts easier to read and reduces the chance of losing your place.
For 8 responses, make one group of five and three more marks: 5 + 3 = 8. For 6, make five and one more. A child who writes a fresh numeral after every response can practise tallies with counters first.
When the counting finishes, transfer the totals to a table. The heading should say what was counted and the column labels should identify the categories and their quantities.
| Fruit chosen | Number of responses |
|---|---|
| Banana | 8 |
| Mango | 6 |
| Guava | 4 |
| Total | 18 |
Check the total: 8 + 6 + 4 = 18. The table lets us find an exact count without estimating a height or counting pictures.
Pictographs: read the key first
A pictograph uses pictures or symbols to represent quantities. The key tells us the value of one symbol. A symbol does not always represent one response.
For our fruit counts, let one circle represent 2 responses:
| Fruit | Symbols: each ○ means 2 responses | Count |
|---|---|---|
| Banana | ○ ○ ○ ○ | 4 2 = 8 |
| Mango | ○ ○ ○ | 3 2 = 6 |
| Guava | ○ ○ | 2 2 = 4 |
Counting four banana symbols and answering “4” ignores the key. Ask your child to point to a symbol and say how many responses it represents before reading the whole row.
If a count does not fit a chosen key, use a smaller key or a clearly explained part-symbol when appropriate to the textbook. Do not round a count merely to make the pictures fit.
Bar graphs: labels, scale, then bars
A bar graph can show the same fruit counts. Categories run along one axis; the other axis has a numerical scale. The bars should have equal widths, gaps between separate categories and a common zero baseline.
The scale increases by 2 at each labelled step. The mango bar reaches 6, not 3: it passes three steps, each worth two responses. Read the scale values rather than count the grid lines.
To draw the bar graph, start from the table. Mark the scale before drawing bars, keep the spacing consistent, and check each height against the original count.
Ask different kinds of questions
- Read a value: how many mango responses? 6.
- Compare: how many more banana than guava responses? 8 4 = 4.
- Combine: how many mango and guava responses together? 6 + 4 = 10.
- Find a total: how many responses altogether? 18.
“Most popular” only describes the largest count in this example. It does not prove that most children everywhere prefer bananas. A display answers questions about the information actually collected.
Common mistakes
- Missing the key: read the pictograph key aloud before counting.
- Unequal scale steps: check that equal distances represent equal numerical changes.
- Adding category names: add the quantities, keeping the labels alongside them.
- Making an unsupported claim: distinguish what the display shows from a wider guess.
Five-minute games for home
- Shape sort: sort a small set of blocks, count each category and make a table.
- Reading record: use made-up counts of books read to practise bar graph questions without comparing children.
- Class choices: collect anonymous choices from a short list of games and display the totals.
- Cricket table: use invented runs from four overs to practise reading and combining entries.
- Change the display: show one table as both a pictograph and a bar graph, checking that the totals remain unchanged.
Indie's challengeA pictograph has a key of one symbol = 2 books. Shelf A has 5 symbols and Shelf B has 3. How many more books are on Shelf A? Show the answer
Shelf A has 5 2 = 10 books and Shelf B has 3 2 = 6. The difference is 4 books. The two-symbol difference also represents 2 2 = 4 books.
Free data handling worksheets
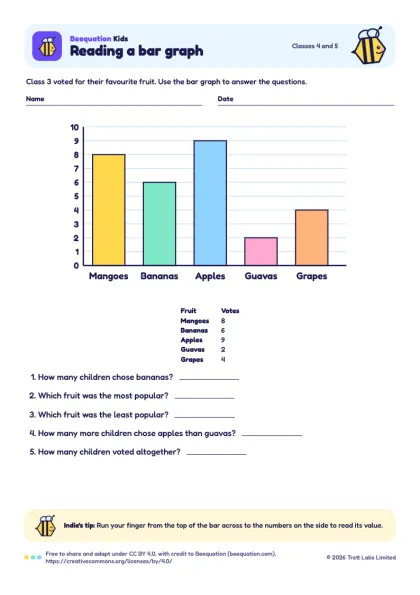 Reading a bar graphClass 4, Class 5 · Favourite fruit surveyDownload PDF
Braille (BRF) (1 KB) · Braille text (2 KB) · Tactile pictures (PDF) (41 KB)
Questions parents and teachers ask
Yes. Reading clear examples builds familiarity with labels and scales. Drawing a bar graph from a small table then helps them understand how each feature represents the data.
Leave gaps between separate categories in a primary bar graph. Use equal bar widths and consistent gaps so width does not suggest an extra meaning.
They are not in the current NCERT books for Classes 1 to 5, though some private books include them in Class 5. Follow your child's textbook.
Practise with Indie
Beequation Kids turns number facts into honeycomb puzzles, with Indie giving a hint when a child is stuck. No ads and no data collected.